New PFAS Monitoring Requirements

In April 2025, the United States Environmental Protection Agency (EPA) and the Oregon Health Authority (OHA) announced the final National Primary Drinking Water Regulations (NPDWR) for six Per- and Polyfluoroalkyl Substances (PFAS). These regulations come amid an increasing incidence of detections of PFAS in public water systems across the country.

What are PFAS?

PFAS are a group of chemicals linked to a variety of health issues when exposed over a long period of time or at specific developmental stages. These chemicals have been used for several decades in a variety of products including non-stick cookware, waterproof fabrics, insulation, and firefighting foams. While the use of many PFAS chemicals has been discontinued, others are still in use today. PFAS break down extremely slowly in the environment and are commonly referred to as “forever chemicals”.

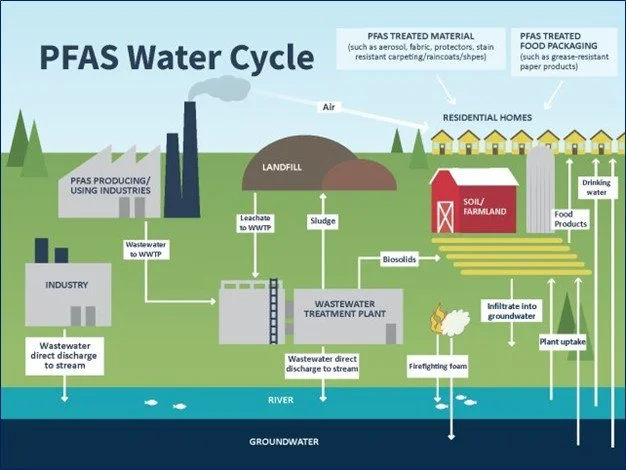
Credit: United States Environmental Protection Agency

State and Federal Monitoring Requirements

In Oregon, in accordance with EPA regulations, public water systems serving fewer than 10,000 people are required to conduct initial monitoring by 2027. For groundwater sources, two sampling events are required to occur within a two-month window, 5-7 months following the first qualified sampling event. For surface water sources, four consecutive quarterly samples two to four months apart are required within 12 months.

The OHA, in cooperation with the Department of Environmental Quality (DEQ), is currently working to schedule one of the two required sampling events for all Community and Non-Transient, Non-Community (NTNC) water systems serving less than 3,300 people, free of charge. DEQ’s sampling program is expected to be completed between Fall 2025 and Spring 2026. This means that all public water systems classified as either Community or NTNC serving fewer than 3,300 people will only be responsible for conducting one PFAS sampling event, assuming these water systems conduct a second round of sampling within 5-7 months of the DEQ’s sampling event. Systems serving populations between 3,300 and 10,000 people will be responsible for both initial sampling events.

Following the completion of initial monitoring, additional compliance monitoring will be required at an interval dependent upon the results of the initial monitoring. For systems without PFAS detections or with detections below trigger levels, sampling will be required once every three years. For systems with detections of regulated PFAS constituents above established trigger levels, quarterly compliance monitoring will be required until the water system demonstrates PFAS below trigger levels for three consecutive annual measurements. At that point, the water system can revert to triennial monitoring. This monitoring schedule will begin in 2027. By 2029, all public water providers with drinking water sources shown to exceed the MCLs must implement solutions to reduce concentrations of PFAS to below trigger levels.

Available Funding

There is funding available to help water systems comply with these new rules through the Bipartisan Infrastructure Law, including $4 billion for work related to Emerging Contaminants (PFAS) and $11.7 billion allocated to State Revolving Funds (SRF). In Oregon, these funds are managed by the OHA and Business Oregon. Typically, applications for funding are due on February 15 and August 15 of each year, depending on the fund being applied for. More information can be found on each agency’s website

-Oregon Health Authority (https://www.oregon.gov/oha/ph/HealthyEnvironments/DrinkingWater/SRF/Pages/index.aspx)

-Business Oregon

(https://www.oregon.gov/biz/programs/sdwrlf/pages/default.aspx)

Recommendations

CwM recommends that public water systems begin planning for these additional monitoring requirements now. This includes developing a sampling plan, communicating with DEQ about scheduling complimentary sampling, and exploring options for treatment or source mitigation if PFAS are detected. Beginning this process now increases a water system’s likelihood of successfully securing funding and scheduling sampling to make full use of the results of the DEQ’s sampling program.

CwM is experienced in assisting small and medium-sized water systems with conducting routine sampling, applying for funding, developing sampling and analysis plans, and soliciting bids for treatment systems. CwM’s staff has already completed PFAS sampling for several municipal water systems in Oregon and has helped systems secure funding for PFAS sampling and treatment feasibility studies.

Alternate Reservoir Permitting Process

In Oregon, water is a public good. This means that any water, even if it is located on your property, is subject to regulation by the Oregon Water Resources Department (OWRD). This policy, which is common to most western states, grants priority to water users who have been using water for the longest. During times when water supply is scarce, senior water users have priority over water users with younger water rights. In most cases, water users are required to apply for water rights through the OWRD to receive permission to use water.

Water Right Permits and Uses

Water rights, both in the form of a Permit, which grants temporary permission to develop the appropriation and use of water, and as a Certificate, which permanently certifies a water user’s water right, specify what the water may be used for. Often, water users may choose to store water in a reservoir, lake, or pond during the wet season for use during drier times of the year. This, like other water-use types, requires a permit. In Oregon, there are two types of reservoir permitting processes: Standard and Alternate. We often find that our Clients are eligible for the Alternate Reservoir process, which is simpler and more streamlined.

Alternate Reservoir Permit

A potential water user may choose to file an Alternate Reservoir Permit Application if their proposed storage meets the following criteria:

·       The reservoir must store less than 9.2 acre-feet (3.0 million gallons) of water,

OR

·       The reservoir must have a dam less than 10 feet high.

Applicants whose reservoirs do not meet at least one of these criteria must apply for a reservoir water right permit using the Standard Reservoir application. The standard application has more complex requirements, including an engineer’s approval. The State, including the OWRD, the Oregon Department of Fish and Wildlife (ODFW), the Department of State Lands (DSL), and other agencies all have interest in regulating water storage to ensure it does not impact senior water users, threatened fish and other aquatic species, and fragile wetland ecosystems.

Ian Godwin, RG, CWRE collects depth and water quality data during a bathymetric survey conducted in support of an Alternate Reservoir Permit Application.

The Alternate Reservoir Permit Application includes several components that satisfy the regulatory requirements for each of the agencies involved. These include:

·       Completed Alternate Reservoir Permit Application

·       Completed Watermaster Review Sheet

·       Completed Oregon Fish and Wildlife Review Sheet

·       Completed Land Use Information Form (by County and/or City or jurisdiction)

·       Legible and Accurate Application Map

·       Legal Description of the Property

CwM has worked with reservoir owners on many occasions to properly permit and certify both storage reservoirs and aesthetic ponds. If you have any questions about the reservoir permitting process or storage permit certification process, please contact CwM for assistance.

Sanitary District Site Visit – Lane County, OR

CwM recently began working with a small rural wastewater Special District located in central Lane County after successfully developing a $100,000 grant application to support the District. The funding is part of Representative Cedric Hayden’s Rural Infrastructure Special District Grant, which in turn is related to the national Infrastructure Investment and Jobs Act (IIJA). The District and its wastewater treatment facility have been in operation since the early 1980s and currently serve about 700 residents. The treatment facility utilizes a large drainfield, originally constructed under an EPA grant, to dispose of treated effluent to the subsurface. The District is currently in need of a new Water Pollution Control Facility (WPCF) permit to regulate and manage its continued operations. CwM is assisting in the process of obtaining a new WPCF permit by characterizing hydrogeologic conditions at the drainfield site and monitoring shallow groundwater.

CwM staff locating and characterizing monitoring wells (left) and assessing the drainfield area (right).

CwM staff took the Sanitary District site visit as an opportunity to to some exploring in the upper Willamette River watershed. The District’s treatment facility is located below the Dexter Lake Dam. Dexter Lake is the lower of two adjacent dammed lakes on the Middle Fork of the Willamette River, the other being Lookout Point Lake and Dam. The lakes were constructed in 1953-1954 by the US Army Corps of Engineers. The beautiful lakes and surrounding parks provide many opportunities for fishing, boating, rowing, horseback riding, and biking. The two dams also provide flood control for the upper Willamette Valley and produce hydroelectric power for the area.

A view of western Dexter Lake from the earthwork dam. Dexter Dam is visible in the distance.

Happy Holidays & Happy New Year from CwM-H2O!

Looking back on 2022, CwM is proud of the work we have done and new relationships we have built within the water resources, water rights, and water conservation fields. We would like to thank all of our amazing clients and partners for playing a pivotal role in our success and for making 2022 an excellent year. Now, we are excited to take on new challenges in 2023!

Our 2022 just would not have been complete without a site visit in the snow. Before the Holiday break, CwM staff had the opportunity to visit a beautiful vineyard property in the rolling hills of central Wasco County. The goals of the visit were to identify several irrigation wells, examine the irrigation network in place on the property, and to enhance our understanding of the geomorphology and hydrogeology of the region.

A little snow has never stopped Bob Long from visiting a vineyard.

Despite the snow, CwM staff were able to identify four irrigation wells and determine their hydraulic relationship based on geologic cross-sections we had prepared earlier. We also locate the trace of an extensional fault at the surface near the property and located several artesian wells lower down in the valley. The information gained from the site visit helped CwM to prepare a more robust analysis and list of recommendations for the client regarding improvements to their irrigation system and water rights portfolio.

Irrigation wells can be a bit harder to find in snowy conditions and in such hilly topography!

Found one! Ian Godwin checks the well ID tag to cross-reference against well logs from the area.

11th International Symposium on Managed Aquifer Recharge – Long Beach, CA

Members of the CwM team were fortunate to attend the 11th edition of the International Symposium on Managed Aquifer Recharge (ISMAR) this month. The event is organized by the International Association of Hydrogeologists, UNESCO, and the American Society of Civil Engineers and has previously been held in locations from Adelaide to Beijing, Madrid, and Abu Dhabi, among others. This year’s conference was held in Long Beach, California and had a heavy emphasis on water issues in the Western US and similar semi-arid regions.

ISMAR is a highly focused event intended to improve research, communication, and implementation of engineered Managed Aquifer Recharge (MAR) across the globe. This year’s event included attendants from six continents with presentations on Aquifer Storage and Recovery (ASR) case studies and technological advancements, application of surface infiltration methods, biogeochemical processes related to MAR, geophysical and remote sensing technologies, and societal and governmental frameworks for expanding MAR for various purposes. Ongoing research on and practical applications of MAR are not only for groundwater level recovery, but also for improvements of groundwater quality, preventing seawater intrusion in coastal areas, and enhancing climate resilience.

Among the highlights of ISMAR 11 was a field trip around the Orange County Water District (OCWD) to view their water source management, MAR, and water recycling systems. OCWD provides high-quality drinking water to more than 2.5 million people in the Los Angeles-Anaheim area and manages the Orange County Groundwater Basin. The largest natural source of water to the District is the Santa Ana River which flows from the San Bernardino Mountains to the northeast. In east Anaheim, OCWD has developed a system of levees and adjustable dams which divert excess flows from the river into recharge channels. These channels are maintained and managed to keep infiltration rates as high as possible. In some cases, up to 100 cfs (44,880 gpm) can be diverted and recharged through the Santa Ana River recharge channels. The diversions are placed such that the recharged water is able to flow through the Shallow Aquifer and into the deeper Principal Aquifer in the basin, which is the primary groundwater source for the area. The channels also provide wildlife habitat and opportunities for recreation.

A rubber dam diverts up to 100 cfs (about 35 cfs in this photo) from the Santa Ana River into a parallel recharge channel.

OCWD utilizes other sources of water, including precipitation, imported water from the California Aqueduct and Colorado River, and recycled wastewater. These sources of water are used for more dispersed recharge through about a dozen infiltration basins throughout the Anaheim area. These basins range from just a few feet to over 50 ft in depth and area each operated in a manner optimized to that basin. The highest performing basin is the La Palma Basin, which can infiltrate about 10 ft of water per day. At this level of infiltration, the basin can recharge about 85 cfs (38,150 gpm) continuously. The recycled water used to fill the basin is so clean that infiltration can continue at this rate for a year before maintenance is necessary.

The La Palma Recharge Basin in Anaheim recharges about 85 cfs of high-quality recycled water 24-7 and is one of many recharge basins distributed across the City.

Much of the water used for the groundwater recharge basins comes from OCWD’s Groundwater Replenishment System (GWRS). The GWRS is the largest wastewater reuse and recycling system in the world and allows OCWD to manage the arid, highly-populated Orange County Groundwater Basin sustainably. Up to 100 million gallons per day of secondary wastewater can be delivered to GWRS each day from the sanitation district. The water passes through three main phases (microfiltration, reverse osmosis, and UV treatment) before becoming high-quality drinking water, which is then used for recharge through the infiltration basins or for the OCWD seawater barrier injection wells.

Raw water microfiltration basins at the OCWD Groundwater Replenishment System. About a dozen basins, each with four Memcor filter tubes (right) receive raw water from the Orange County Sanitation District. Each filter tube can process about 2 million gallons per day, removing particulate larger than 0.2 microns.

Inside of the Groundwater Replenishment System’s Reverse Osmosis Building. Over 100 million gallons of water per day is purified through about 2,500 RO chambers, which remove almost all dissolved constituents larger than a water molecule. The group is being shown the RO membrane that is contained within each chamber.

The last stage of treatment is UV sterilization. The 100 million gallons per day passes through large-diameter pipelines filled with UV light tubes, which provide about 10 seconds of high-intensity UV contact time for the process is complete. In addition to killing any biological components in the water, the UV process breaks down chemical residues from the RO process.

The end product of microfiltration, reverse osmosis, and UV sanitation of recycled wastewater is high-quality drinking water. This water is used to recharge thousands of acre-feet of groundwater in the Los Angeles Basin each year to maintain aquifer sustainability, improve groundwater quality, and prevent saltwater intrusion.

Western Blue Mountains Field Trip: Clarno, John Day, Picture Gorge, and Mascall Formations

Members of the CwM team recently traveled out to east-central Oregon for field work, stopping along the way to view some of the major geologic formations of the western Blue Mountains. Their trip took them through the towns of Fossil, Spray, Kimberly, Dayville, and Mitchell. In the process, they drove across 45 million years of geologic history from the Clarno Formation to the Rattlesnake Formation.

Clarno.png

Driving south from Fossil, the team encountered several crumbling outcrops of the Clarno Formation, which consists of pale andesite and rhyolite lava flows, ash-fall deposits, and volcanic breccias. The volcanic activity that created the Clarno Formation occurred between about 55 to 40 million years ago, which predates the activation of the Cascade volcanoes. Several debris flow deposits within the Clarno preserve the seeds and leaves of palm and avocado trees, suggesting a tropical climate during this period.

PaintedHills.png

The famous Painted Hills are located near Mitchell, due south of Fossil. The hills are comprised of alternating layers of bright red, yellow, gray, and black paleosols (ancient soil) that were formed in a large floodplain between about 38 and 32 million years ago. The tropical climate represented in the late Clarno Formation continued into this period but began to shift. Wet and warm periods created bright red layers of soil, rich in iron and aluminum. Yellow soils, where metals were leached out, represent shifts to cooler and drier climate. Though not visible in the image above, both the red and yellow soil layers are often dotted with 2-4 foot-wide black patches of organic rich soil. These patched formed where dense vegetation was clustered throughout the floodplain.

SheepRock.png

On the east side of Highway 19 between Kimberley and the John Day Highway, the pinnacle of Sheep Rock can be clearly seen for several miles. The red, greenish-gray, and pink layers that form the base of Sheep Rock belong to the John Day Formation. The red claystone layer in the foreground is the Big Basin Member, the lowest unit of the John Day Formation, which was formed 40 to 32 million years ago (same time as the Painted Hills). Moving upward on Sheep Rock you next reach the greenish-gray siltstone of the Turtle Cove Member (32 to 26 million years). Cutting across the middle of Sheep Rock is the dark brown Picture Gorge Ignimbrite, which has been precisely dated to 28.8 million years old. Finally, the upper Kimberly Member of the John Day Formation appears as a pale pink claystone that was formed 26 to 24 million years ago and is capped by the Picture Gorge Basalts that hold up the pinnacle.

PictureGorge.jpg

The Picture Gorge Basalt Flows are a member of the much larger Columbia River Basalt Group that formed about 16 to 14 million years ago. The Picture Gorge flows originated from a series of fissures that were formed due to tectonic pressures from the subducting Farallon Plate. A total of 61 separate eruptions occurred roughly every 15,000 years, eventually producing the 1,300 foot-thick Picture Gorge sequence covering about 2,500 square miles. The John Day River has cut through many of these flows in Picture Gorge along Highway 26 and Highway 19.

Mascall.png

The Picture Gorge basalt flows were not the only volcanic activity during this time. Starting at the same time and continuing after the flood basalts ceased, nearby volcanoes erupted and deposited hundreds of feet of ash across the region. The bright white Mascall Formation, seen here in an outcrop near Dayville, was formed between 16 and 12 million years ago from andesite and rhyolite ash. Much of the ash was deposited in large, shallow lakes or was reworked by meandering streams. The resulting volcanic tuff is very light weight and has a chalky consistency. For several million years after the Mascall Formation was deposited, the region experienced uplift and significant erosion that erased about 4 million years-worth of rock. Capping the Mascall Formation across the region is a layer of mixed cobbles, gravels, and silt that belong to the Rattlesnake Formation. This conglomerate was deposited about 8 to 5 million years ago by energetic streams flowing from the recently uplifted mountains nearby.

Sources:

Bestland, E.A., Hammond, P.E., Blackwell, D.L.S, Kays, M.A., Retallack, G.J., & Stimac, J. (2002). Geologic Framework of the Clarno Unit, John Day Fossil Beds National Monument, Central Oregon. State of Oregon Department of Geology and Mineral Industries. Open-file Report O-02-03.

National Park Service. (2013). John Day Fossil Bed National Monument, Sheep Rock Geology. U.S. Department of the Interior.

Schlicker, H.G. & Brooks, H.C. (1975). Engineering Geology of the John Day Area, Grant County, Oregon. State of Oregon Department of Geology and Mineral Industries. Portland, Oregon.

Thayer, T.P. & Brown, C.E. (1966). Geologic Map of the Canyon City Quadrangle, Northeast Oregon. United States Geological Survey.

Thayer, T.P. (1972). Geologic Setting of the John Day Country, Grant County, Oregon. United States Geological Survey.

Columbia Gorge Field Trip: Troutdale Formation and Boring Basalt

The CwM team could not resist the early summer-like weather in the Pacific Northwest and took a “Geology-Friday” field trip into the Columbia River Gorge. Their trip took them east from Portland to the Sandy River, along the Historic Columbia River Highway through Corbett, with stops at the Latourell and Bridal Veil Falls, and back west along the banks of the Columbia River. The goal was to find outcrops of the Troutdale Formation, parts of which make up an important groundwater source in the Portland metro area and part of the City of Portland’s Columbia River Wellfield.

The Troutdale Aquifer is a sequence of silts, sands, gravels, and cobbles that were deposited starting about 3-4 million years ago and overlie much of the Miocene-age Columbia River Flood Basalts in the Portland area, filling the canyons and valleys that were cut into the basalts. The sediments of the Troutdale originated from ancient channels of the Columbia River, the many streams coming off the west slopes of the ancestral Cascades, as well as significant ashfall from the High Cascade volcanic activity. Potassium-argon dating of volcanic clasts in the Upper Troutdale suggest that deposition continued until at least 1.5 million years ago.

The Troutdale is generally divided into two subunits. The Lower Troutdale was formed primarily by deposition in ancestral channels of the Columbia River and varied from well sorted sandstone to gravel and cobble conglomerates with diverse lithologies. Both materials often exhibit strong characteristics of their depositional environment, such as cross-bedding in the sandstone and imbrication of cobbles. The Upper Troutdale exhibits greater influence from concurrent volcanic activity and primarily consists of vitric sandstone and basalt conglomerate. Both units are interlayered with much finer-grained silts and clays usually assigned to the Sandy River Mudstone Formation.  

Of the eight hydrogeologic units that form the Portland Basin Aquifer System, the Troutdale Gravel Aquifer (TGA) and the Troutdale Sandstone Aquifer (TSA) are the most important for water supply. Both aquifers are common sources of water for municipal and irrigation wells in the Portland Basin. Some City supply wells in this aquifer have been tested at more than 2,500 gallons per minute. 

Outcropping of the Troutdale Formation along the Historic Columbia River Highway

Outcropping of the Troutdale Formation along the Historic Columbia River Highway

The CwM team found a good exposure of the Troutdale Formation along the Historical Columbia River Highway about 2.5 miles south of the Sandy River Bridge. This particular site exposes a relatively thin section of the Troutdale around the transition from Lower to Upper members. At the base of the outcrop, the upper 20 ft of grayish lithic sandstone is exposed. Cross-bedding features characteristic of river channel deposition can be seen. About 20-25 ft of coarse cobble conglomerate was visible above the sandstone. The cobbles were almost entirely of an olivine basalt composition, which is more representative of the Upper Troutdale. At the very top of the outcrop sit large boulders of the Boring Basalt, which formed in the early Pliocene.

Sources:

Evarts, Russell. (2021). Geologic Map of the Ridgefield Quadrangle, Clark and Cowlitz Counties, Washington.

Swanson, R.D., McFarland, J.B., Gonthier, J.B., & Wilkinson, J.M. (1993). A Description of Hydrogeologic Units in the Portland Basin, Oregon and Washington. USGS Water-Resources Investigations Report 90-4196.

Tolan, T.L. & Beeson, M.H. (1984). Exploring the Neogene History of the Columbia River: Discussion and Geologic Field Trip Guide to the Columbia River Gorge. DOGAMI. Oregon Geology, Vol 46 (9).

Wilsonville WTP Visit and Groundwater Recovery

The CwM team is proud to be working with the City of Wilsonville to help them manage their water rights portfolio. The City of Wilsonville holds multiple groundwater rights and a large surface water right on the Willamette River. From the late 1980s until the early 2000s, the City depended solely on groundwater from the Columbia River Basalt Group (CRBG) aquifer for municipal supply. The growing City’s demand for groundwater resulted in accelerated groundwater level declines. In 2002, the City brought their state-of-the-art water treatment facility online and switched completely to surface water. CwM was lucky to visit this facility in November, which is now being expanded in partnership with the City of Sherwood and the Willamette Water Supply Program.

CwM’s Bob Long visiting the raw water pump room at the Wilsonville Water Treatment Plant

CwM’s Bob Long visiting the raw water pump room at the Wilsonville Water Treatment Plant

The City’s rapid transition from groundwater dependence to a surface water source affords a unique opportunity to observe groundwater recovery in the Columbia River Basalts. CwM collected data from six CRBG wells in and around Wilsonville spanning 1960 to present. From the 1960s to 1988, when Wilsonville’s current groundwater system was operational, groundwater levels declined at an average rate of 1.00 ft/year. During the period before the transition to surface water, from 1988 to 2002, the groundwater levels dropped at a jaw-dropping rate of 3.59 ft/year. Amazingly, groundwater levels rebounded rapidly once pumping to meet the growing City’s needs was halted. The recovery averaged 1.33 ft/year from 2002 to 2020. As evident in the plot below, representing data from all six study wells (Wash 3561, Clac 9074, Clac 50585, Clac 8184, Clac 8043, and Clac 278), rate of recovery has slowed as levels approach 1960’s levels. Data like these demonstrate the storage volume of the aquifer and the regional rate of groundwater recharge. With this data, a new sustainable use of the CRBG in this area is  possible and gives hope for recovery in other groundwater critical areas of the state.

Plot of groundwater level changes over time. Groundwater level for several wells in the Wilsonville area relative to the level in 2002, when pumping at Wilsonville was decreased. There has been a rapid recovery of groundwater level over the last 18 …

Plot of groundwater level changes over time. Groundwater level for several wells in the Wilsonville area relative to the level in 2002, when pumping at Wilsonville was decreased. There has been a rapid recovery of groundwater level over the last 18 years.

The Wilsonville Water Treatment Plant office

The Wilsonville Water Treatment Plant office

Spring happenings at CwM-H2O

In February CwM-H2O staff welcomed Portland State University student-athlete Demontre Thomas II to its office for an informational interview about water resources and management. We wish Demontre much success in his future studies and career development.

CwM-H2O staff enjoyed the sunny late winter weather while clearing trash from and planting 60 daffodil bulbs in the curb-side swale neighboring its office building on SE MLK Jr. Blvd. This 139-foot swale is enrolled as part of the City of Portland’s Green Street Stewards program. Goals of the program include maintaining urban rain gardens that collect and filter storm water, prevent pollutants from reaching local watersheds, and increasing green spaces in the city. These flowers will also brighten up a vital business district and busy traffic corridor for years to come.

Bob Long and Demontre Thomas II in February 2020 at our Portland office.

Bob Long and Demontre Thomas II in February 2020 at our Portland office.

Water Rights And The Cannabis Industry

OLCC License Requirements:

Obtaining a license to produce cannabis in the state of Oregon is completed through the Oregon Liquor Control Commission (OLCC).  While the OLCC's licensing process is relatively straightforward, one component of this licensing process consistently causes trouble for applicants.  This problematic component is water rights.

Cannabis is considered a commercial crop by the state of Oregon, and as such, the OLCC requires cannabis producer applicants to submit either:

  1. A water right permit or certificate (issued by the Oregon Water Resources Department);

  2. A statement that water is supplied from a public or private water provider; or

  3. Proof that water is from a source that does not require a water right.

All too often, potential cannabis producers have to put the development of their operations on hold due to a property lacking water rights.

Water Rights Overview:

While source water for the production of cannabis can be hauled in by truck or obtained through exempt methods such as certain rainfall collection methods in fulfillment of OLCC requirements #2 and #3 above, these practices are often expensive, impractical, and inconvenient for producers.  Subsequently, most producers seek to obtain a water right from the Oregon Water Resources Department.  While Oregon water law is highly complex, the water right process can be boiled down to the following process:

  1. Apply For A Water Right Permit: To apply for a water right permit, applicants are required to submit maps, expected water use volumes and rates, have county approval for land usage, and understand water restrictions of the land. Obtaining a permit generally takes 3-4 months if all goes smoothly.

  2. Certify A Water Right Permit: Once you obtain a water right permit, you have a set amount of time to prove that you are beneficially using the water you are permitted to use. At the end of this period of time, you must have a certified water rights examiner document the usage of your water and irrigation system. If you fail to certify your water right, you can lose your water right permit along with its associated water supply.

Picture: Documents illustrating the complexity of the water right permitting process

Picture: Documents illustrating the complexity of the water right permitting process

How Do I Know If I Need A Water Right:

As dictated by Oregon law, all water is publicly owned.  This means that while water may be flowing on, through, or under your property, you are not automatically entitled to use it.  The following are examples of properties requiring a water right:

  • Properties with private wells

  • Properties with natural springs

  • Properties with surface waters (creeks, ponds, etc.)

Due to the complexity of Oregon water law, and the local variability of restrictions and nuances associated with the water right permitting process, attempting to navigate the water right process can seem daunting.  CwM H2O has been successful in helping cannabis producers across the state to obtain or certify water rights, and can help you solve any water related issue you are having.  Call us at (503) 954-1326 if you would like to discuss water related challenges your operation is facing.